BASEline Documentation
Getting Started
BASEline is a set of tools designed to help skydivers and BASE jumpers improve wingsuit flight performance. BASEline consists of two parts:
- https://baseline.ws is an interactive website to help process and analyze flight data.
- BASEline Flight Computer is an android app that uses phone sensors to provide audible and visual feedback on speed and position, as well as logging data for later analysis.
Warning: Skydiving, BASE jumping, and wingsuit flying are inherently risky activities. Data in BASEline may be inaccurate, and you should not make life or death decisions based on it.
Hardware
Getting accurate data is essential. The easiest way to get the most accurate data is to use a FlySight.
You can also record flight data directly using the BASEline Flight Computer app. The app has the advantage that it can give in-flight audible feedback, can stop when it detects landing, and can upload automatically to baseline.ws. However, the app requires connecting to an external bluetooth GPS to get good data.
Skydiving
BASEline can be useful in multiple ways in the skydive environment depending on your goals. The two main uses in skydiving are 1) data logging for later analysis on the ground, and 2) In-flight audible feedback of your speed or glide ratio.
BASE Jumping
BASEline is primarily designed for BASE jumping. During a BASE jump, it is strongly recommended that you use BASEline only to record data. Features such as audible and visual feedback are intended for use only in the skydiving environment.
BASEline is useful for multiple aspects of BASE jumping:
- Comparing GPS flight data with previous flights and exit profiles.
- Measure exit profiles using a laser rangefinder.
- Overlay track data on google earth.
- Explore exit points.

Analyze Jump Data
To analyze wingsuit flight data, first you must record GPS data from your skydives and BASE jumps. If you don't have a GPS logger, check out our hardware setup guide.
Once you have tracks uploaded to baseline.ws you can:
- Display your horizontal speed, vertical speed, total speed, and glide ratio during a jump
- Display a profile view of your start performance on a BASE jump
- Compare your start performance across multiple BASE jumps
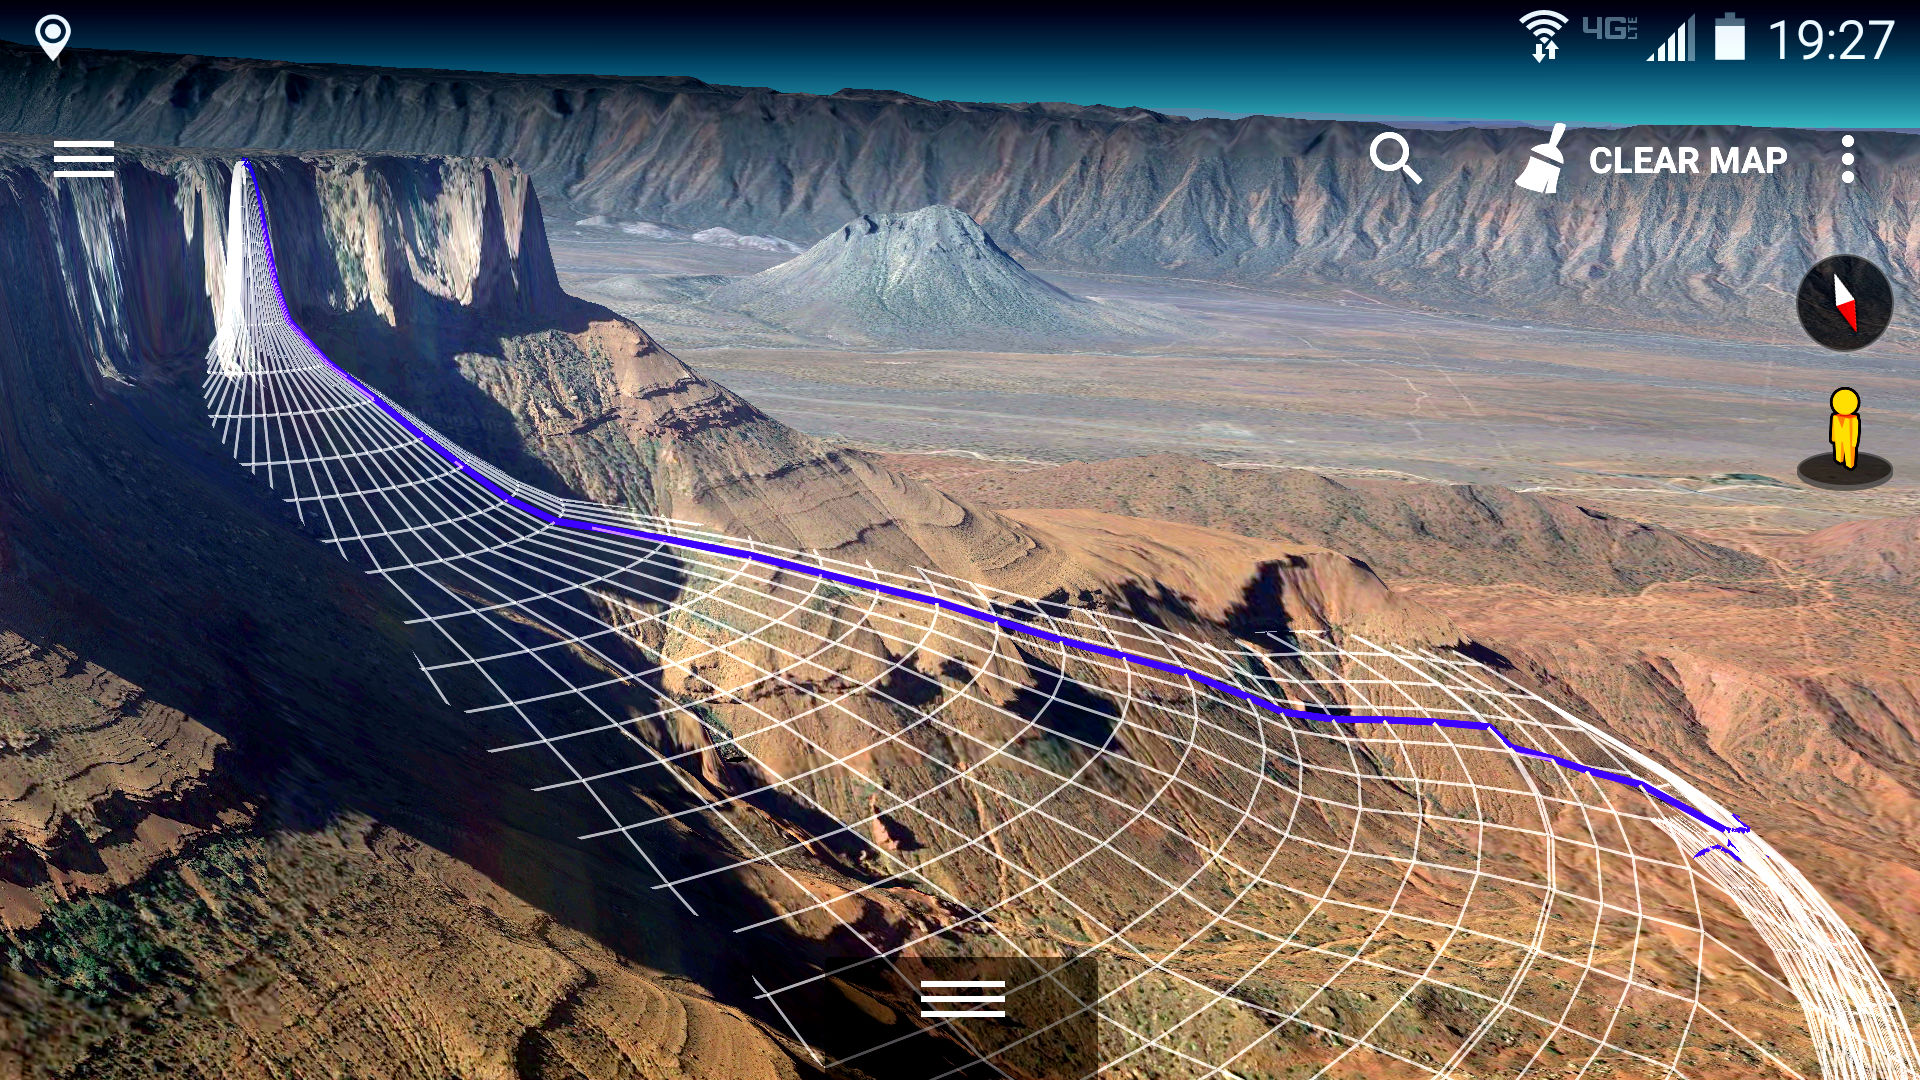
- Visualize a jump in 3D using Google Earth
- Evaluate flight plans using Google Earth
Upload tracks
The easiest way to upload tracks to BASEline is to record the data using the BASEline Flight Computer app. Once you sign in using your google account, the app will sync tracks directly to your BASEline account.
You can also upload track files to the website from your computer (if you have a FlySight, for example). Once you are signed in to baseline.ws, you should see the upload area on your tracks page:
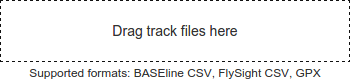
BASEline currently supports track uploads from the following sources: BASEline Flight Computer, FlySight, GPX files, and some KML files.
Visualize in 3D
From the track page on baseline.ws, click "Open in Google Earth" to download a KML file with your jump data.


Charts
Time Chart
The time chart displays track data with time on the horizontal axis. Altitude, speed, and glide ratio are shown on the vertical axes. Speed is shown as separate horizontal and vertical speed components.
By clicking and dragging across the time chart you can trim the track. Trimming the track helps with removing unimportant data before and after the jump. Trimming also sets the exit point, so that calculations of time and distance are relative to the true start of the jump.

Zoom in or out on the time chart by scrolling on the bottom time axis.
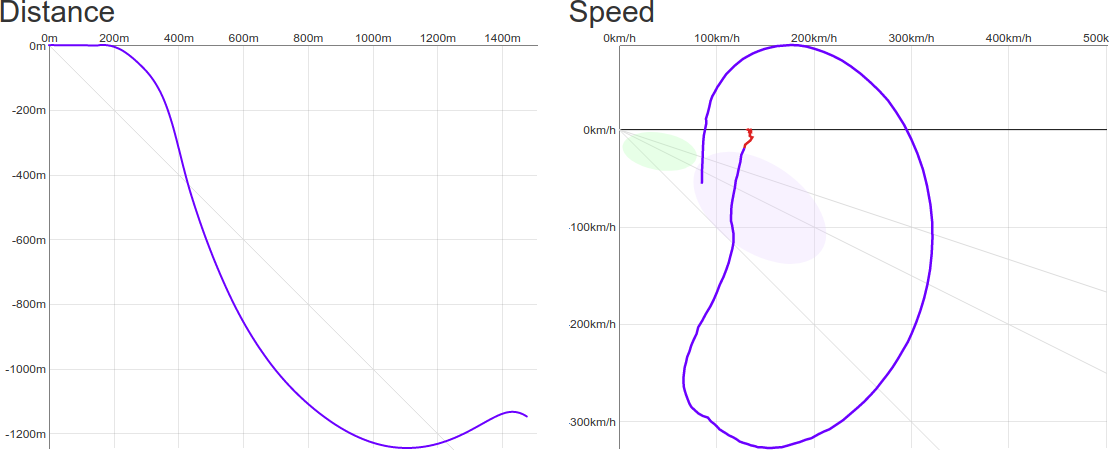
Distance Chart (Flight Profile)
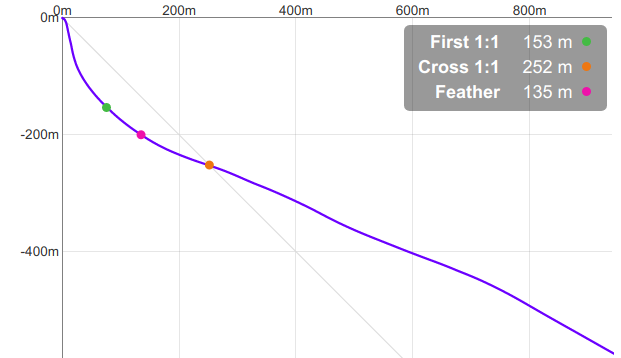
The distance chart is a side profile view of your flight. It displays change in altitude and distance relative to your exit point. The vertical axis is the change in altitude relative to the exit point. The horizontal axis is the distance from a given point to the exit point.
This chart is most useful for measuring start performance in the BASE environment. As soon as you make a turn, the flight profile will no longer mean much because you are no longer flying straight away from your exit point.
Stats
The summary statistics show distance metrics summarizing the start of your flight. Distance chart stats are only shown for BASE jumping tracks.
- First 1:1
- Vertical distance (altitude) to achieve 1:1 glide ratio
- Cross 1:1
- Distance (horizontal or vertical) to cross a 1:1 line extending from the exit
- Feather
- Horizontal distance flown in 200 meters altitude
For cross 1:1, smaller is better. For feather and kings, bigger is better.
Unroll
The "unroll" switch toggles between straight-line and total distance on the horizontal axis. The difference is subtle but important. The "unrolled" distance chart shows a flattened view of your flight path, measuring the sum total distance traveled from the exit point, including the extra distance covered in turns. If unroll is off, then the distance chart shows the straight-line distance from the exit point, ignoring turns in your flight path.
Total distance is more useful for skydiving, since it "unrolls" the typical flight pattern. In BASE jumping, the straight distance is more useful since it more accurately measures your start performance relative to fixed terrain.
Warning: The "unrolled" distance can be dangerous in BASE, because data errors and noise will tend to OVER-estimate your distance.
Drag the zoom slider to zoom in or out.
Speed Chart (Polar)
The speed chart displays horizontal versus vertical velocity. Diagonal lines show glide ratios of 1:1, 2:1, and 3:1. In gliding flight, this is sometimes referred to as the polar chart.
Learn you some theory from Matt Gerdes and Top Gun BASE about polar charts.

The polar chart is the best tool for understanding your speed during a flight. With a quick glance you can see your horizontal speed, vertical speed, total speed, and glide ratio.

You can see a jump build up speed at the start, and how it translates into horizontal speed. It is also useful for seeing how to build up speed, and convert that into a flare.
Flare Theory
There are a number of factors that go into a good wingsuit flare, and the speed chart is the best tool for fine tuning flare performance. The key to a good flare is 1) building up total speed, and 2) efficiently converting speed into lift.
Leading into the flare, your first priority is to maximize your total (3D) speed. The secondary goal is that it's better to be closer to 1:1 glide ratio than straight headdown. This is because if you are flying straight headdown, you will first have to convert more of your vertical speed into horizontal speed before you can start turning it into a climb.
After you have built up speed, the next stage of the flare involves slowly increasing your angle of attack, to exchange speed for increased lift.
This is a balance of factors. If you flare too quickly, you will have more drag, lose efficiency, and not gain as much altitude. If you flare too slowly, you will be subject to gravity for a longer period of time, and not gain as much altitude.
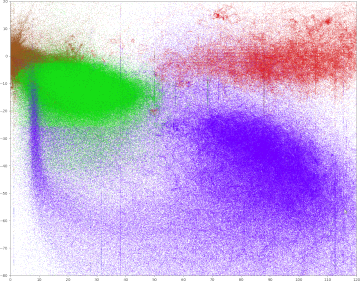
Ellipses
The green ellipse represents typical skydiving and BASE canopy flight envelopes. The purple ellipse represents typical wingsuit flight performance envelope. The purpose of the ellipses is to give a point of reference on the polar chart, so that it can be quickly understood, without having to directly read the speed numbers.
The baseline ellipses are based on data from over 10,000 wingsuit jumps:
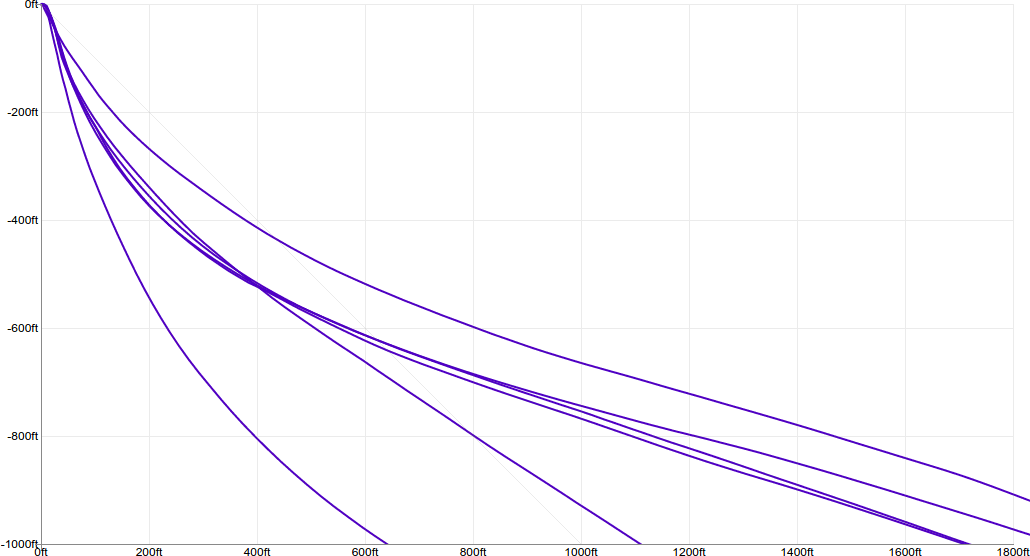
Profile Studio
One of the most technical aspects of wingsuit BASE jumping is start performance. The key to short start jumps is knowing two things: what is your start arc, and what is the shape of the terrain. We call the shape of the terrain its "exit profile."
The best way to compare flight profiles is by using the "Profiles" page. It shows a side profile view of your jumps.
By collecting data from a large number of jumps, you can build up a database of start arcs. You can see the difference between a good start versus a bad start, and evaluate terrain more scientifically. Keep in mind that many factors affect start performance: gear, wind, temperature, elevation, etc.
See chart help for more information.
Exit Profiles
Exit profiles should be measured using an accurate laser range finder.
If you are verified as a BASE jumper, BASEline provides a list of exit profiles contributed by users.
Warning: Exit profiles are submitted by users, and have not been verified by baseline. Always check measurements yourself.
Android App
BASEline Flight Computer is open source and available on github:

Hardware Setup
BASEline Flight Computer uses a combination of sensors in your phone to determine its position and speed. Sensors used include: GPS, barometric altimeter, gyroscope, accelerometer, and compass. Results can vary dramatically from one phone to another.
GPS
Warning: Get an external GPS
Your phone's built in GPS is not a good source of data. The GPS receivers in most phones update their location only once per second (1Hz). The antennas are usually not very good, and it is difficult to mount a phone on the back of your helmet.
It is strongly recommended that you use an external GPS receiver such as the FlySight.
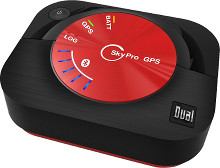
BASEline also supports external bluetooth GPS units such as the SkyPro XGPS160.
Barometer
On phones with a barometer, BASEline uses the barometer as an additional source of height information to augment GPS. However, be aware that high/low pressure areas around the body can affect altitude readings. Higher pressure inside a wingsuit can also cause errors in altitude reading.
Barometric altitude measurements can be disabled in the app settings.
Mounting
It is critical that your GPS device has a clear view of the sky in order to acquire GPS signals. The back of your helmet is generally a good place to put your GPS receiver.
The location of your GPS unit can have a significant effect on the quality of your data. Think about where the "top" of your head is when wingsuit flying, it might be farther back than you think. A GoPro mounted too close can interfere with GPS signal.
FlySight
BASEline is compatible with FlySight. However, FlySight does not have wireless connections, so it is necessary to use a USB cable to copy files from your FlySight.
You can use a computer to upload files from your FlySight to baseline.ws.
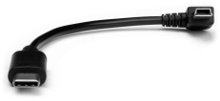
You can also read FlySight files directly from the BASEline android app if you have a USB On-The-Go (OTG) cable. You need a cable that goes from male Mini-USB connector for the FlySight, to your phone (usually USB-C or Micro-USB).
Audible Feedback
1. Prepare for flight
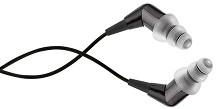
Figure out how you are going to configure your gear with BASEline while on the ground. There are many options for where to put your phone, and how to route audio to your ears. Audio can be difficult to hear without a full face helmet and good quality headphones. Noise isolating earphones work best.
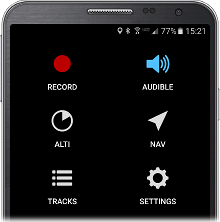
While still on the ground, open the BASEline Flight Computer app. From the home screen, long-click the Audible button to open the audible settings.
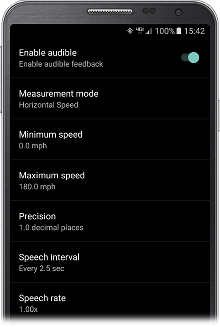
The audible will speak to you while in flight. Current audible modes include:
- Horizontal Speed
- Vertical Speed
- Total Speed
- Glide Ratio
- Navigation
The audible will only say a measurement if it falls between the min and max settings. The speech interval controls how often the audible should read a measurement out loud. The speech rate controls how fast the speech-to-text engine should speak.
Navigation mode is intended to help navigate to a predetermined home location. From the main screen, click "nav", and drag the map so that it is centered on your target location. Once it is centered in the cross hairs on the map, click the pin icon to set the home location. Once the home location is set, navigation mode will read the distance and bearing to the home location, relative to your current location and flight path.
Note: Some phones come with poor quality text-to-speech engine (eg- Samsung). For best quality, install Google Text-to-Speech and set it as the default text-to-speech engine in your android settings.
2. Enable audible
Before jumping, open the BASEline Flight Computer app. From the home screen, long-press the Audible button to enable the audible.
The app should then speak the measurement mode, and begin reading data.
3. Refine body position
Experiment with different body positions and angles of attack. Using this feedback loop, you can learn to optimize your speed and glide ratio.
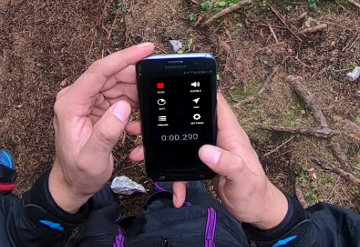
Logging Flight Data
1. Record a GPS track
You can use the BASEline Flight Computer app to log flight data using sensors in your phone. When you click record, BASEline will begin logging all GPS, altimeter, accelerometer, and other sensor data.
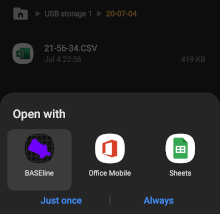
Track data will be written to CSV files on your phone.
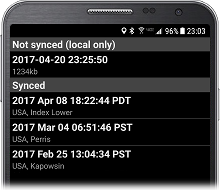
2. Sync tracks to baseline.ws
If you are signed in to your BASEline account, tracks will automatically upload when finished recording. If you are not signed in, or signal is unavailable, you can upload the track later from the tracks screen.
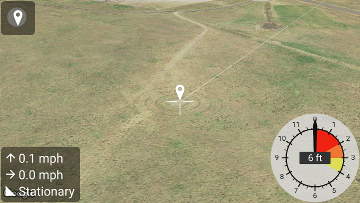
Navigation Mode
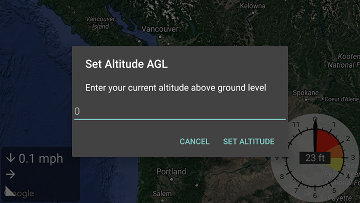
Navigation mode provides visual feedback on speed and position. The main view is a map which will automatically center on your location. The bottom left panel lists climb rate, ground speed, and glide ratio. The bottom right has an analog-style altimeter for your altitude above ground level (AGL).
1. Ensure ground level is set to zero
BASEline Flight Computer uses a combination of GPS and barometer readings to determine your altitude. GPS altitude data is always measured above mean sea level (AMSL). Barometer can only read air pressure, and therefore can only give relative altitude changes. For skydiving and BASE jumping, the most important altitude is how high you are above ground level.
BASEline Flight Computer defaults to setting the ground level to zero when the app is first started. However, you can adjust the ground level setting by long-clicking the analog altimeter. This will give you the option to manually set the altitude AGL.
2. Home location
Navigation mode supports setting a "home" location, which can be useful for navigating to a particular landing zone. Once a home location is set, BASEline will draw a white line from your current location to the home location. You can set the home location by dragging the map. Once you start dragging the map, a target will appear in the center, and a button to drop a pin on the home location will appear.
3. Accuracy trick
Navigation mode also includes a digital version of the accuracy trick. BASEline uses your current altitude AGL, descent rate, ground speed, and bearing to determine your projected landing location. When BASEline can determine your projected landing zone, it will draw a red target, with a red line from your current position to the projected landing zone.
If you line up the projected landing location with the home location, it is possible to land very accurately. Note that projected landing zone assumes steady-state flight, with no changes in flight configuration or wind layers.
Analyze Flight Data
The best way to analyze tracks is to sync with baseline.ws, and review your flight data on the website. The BASEline app can also display flight data as charts in the app.
View on baseline.ws
In the BASEline app, click tracks, verify that you are signed in, click on a synced track.
Click "baseline.ws" to open the track in a web browser on baseline.ws.
Click "earth" to open the track in Google Earth or Google Maps, depending on what apps you have installed.
Profiles
The subterminal phase of a wingsuit BASE jump is the key to being able to jump in more places. To evaluate the feasibility of a jump you must know two things: your start performance in your wingsuit, and the shape of the cliff you want to jump.
GPS Flight Profile
Measuring your start performance requires doing many jumps from a forgiving exit point.
Considerations: Altitude GPS signal quality can vary greatly, based on a number of factors including different hardware, mount location, and geography. For example, Lauterbrunnen has terrible GPS signal, because mountains on all sides block line-of-sight to satellites.
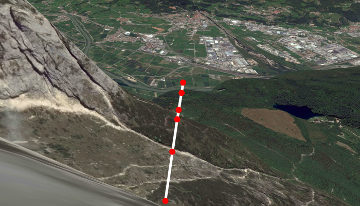
Terrain Profiles
Terrain profiles are a measurement of the shape of a cliff.
It is critical that you measure along a straight line. If measurements are not in a straight line, you will overestimate the steepness of the terrain. That plus the fact that energy is lost in turns means that it is critical that you measure along a straight line.
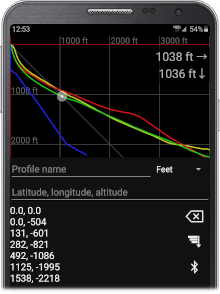
Profile Coordinates
There are different opinions on how to log terrain profiles as measured by a laser. The prefered format is x,y where x is horizontal distance and y is vertical distance (and should be negative). This system is unambiguous about which is horizontal and which is vertical.
20,-100
40,-120
100,-200
Other coordinate systems exist and are supported by BASEline. If you swap the coordinates, BASEline will detect that the vertical coordinate should be negative, and will correctly parse.
-100,20
-120,40
-200,100
Finally, if you measure a jump from the bottom of a cliff, the coordinates need to be translated to be relative to the exit point. Be careful when measuring from the bottom of a cliff, accuracy will not be as accurate from farther away. If BASEline sees all positive measurements, it assumes that the cliff was measured from the bottom and translates the coordinates. BASEline shows a warning when lasering from the bottom.
60,80
80,100
100,200
All three of the examples above represent the same cliff profile.
Laser Rangefinders
There are many laser rangefinders on the market, with a wide variety of features. Considerations when choosing a laser rangefinder for BASE jumping: What is its maximum range? Does it include an inclinometer, and can it do the horizontal / vertical calculation for you? What are the size and quality of the optics? Weight. Cost.
Recently a new type of laser rangefinder has been introduced that includes Bluetooth wireless connectivity. With a bluetooth laser rangefinder, it is possible to connect using the BASEline android app, and generate a terrain profile in the app as you measure the terrain using the laser. This makes the process of measuring terrain much faster and easier.
BASEline is known to work with the following bluetooth laser rangefinders:
- Uineye Laser Rangefinder
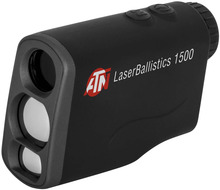
- ATN: LaserBallistics 1000, 1500
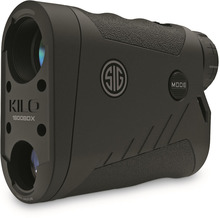
- Sig Sauer: BDX series 1400, 1800, 2200, 2400
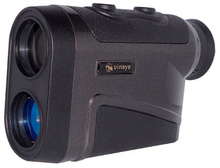
Uineye
The Uineye laser works great, but make sure you get the bluetooth version. Order one through Hartman here.
Laser Calibration
Warning: Always ensure that your laser is properly calibrated.
The Uineye laser comes set correctly, but long-pressing the trigger button resets the angle calibration to zero. This sometimes happens by accident, and can cause invalid readings. Before measuring an exit profile, verify that the measurements are sane by lasering something on-level. If your horizontal/vertical measurements are not making sense, the angle calibration is worth checking.
The Uineye User Manual can be found here.